It takes resources to run a business.
From our 800 maintenance hubs to our extensive network of fueling stations and warehouses, Ryder’s transportation and logistics operations require fuel, electricity, water, and equipment. How those resources are utilized is what makes all the difference in the world.
At Ryder, we believe it is our duty to ensure that the resources necessary to run our operations and those of our customers are utilized responsibly and with minimal impact to the environment. This includes reducing greenhouse gas (GHG) emissions by utilizing and promoting cleaner burning fuels; working closely with OEMs to incorporate the latest and most effective green solutions into trucks and tractors; and ensuring that our vehicles and our customers’ fleets are well-maintained and operating efficiently. In our warehouses we operate under LEAN principles to maximize efficiency and minimize waste.
Our customers rely on Ryder for effective fleet management and supply chain solutions. They can take advantage of Ryder’s 85 years of expertise as well as our position as a leader in our industry to benefit from efficiencies and scalability that they would be unable to achieve on their own, including a level of responsible resource management they can use to profile green solutions to their customers and stakeholders.
Our Approach
Ryder’s Environmental Services Team provides support for various core programs and initiatives, including but not limited to resource conservation and regulatory compliance for areas such as fuel storage and distribution, spill prevention and response, waste management, and energy and water sustainability. The Environmental Services team and Corporate Risk Managers also evaluate priorities and determine material risk thresholds annually to ensure appropriate risk controls and response procedures are in place, including those risks related to climate change impacts. In 2017, Ryder Environmental Services and Ryder Real Estate teams joined forces to provide comprehensive central support services with a strong focus on improving cost efficiencies and sustainable development.
The Corporate Governance and Nominating Committee of the Board of Directors is responsible for overseeing public policy, public affairs, and corporate responsibility. This includes responsibility for Ryder’s environmental programs, which address regulatory and business issues and risks related to climate change impacts and strategy. The Vice President of Environmental, Real Estate, and Fuel Services maintains day-to-day operational responsibility for Environmental Programs including climate change strategy, and reports to the Executive Vice President, Chief Legal Officer and Corporate Secretary. An Environmental Report is provided annually to the Corporate Governance Committee. We report progress on our environmental programs and key initiatives annually to the Corporate Governance and Nominating Committee of the Board of Directors, which maintains oversight of Ryder’s environmental strategy. The Chair of the Corporate Governance and Nominating Committee also provides a report on these matters to the full Board.
core programs and initiatives
Ryder’s long-standing environmental management policies govern our sustainability strategy and reflect our commitment to environmental stewardship. These guiding principles are documented in Ryder’s Environmental Policy and Control Manual, which is available to all employees through the Ryder Policy Portal. Our Environmental Management System (EMS), aligned to ISO 14001 standards, enables us to manage our environmental impacts internally and then modify them as needed based on customer-specific program requests. We have achieved ISO 14001 conformance at select customer sites in the U.S., Canada, Mexico, and the U.K. based on customer requests.
Our business is subject to various environmental laws promulgated by federal, state, local, and foreign governmental agencies. We face the risk that new laws, rules, or regulations may be adopted or interpretative changes to existing regulations could be issued at any time. Any new initiatives could further increase our costs or operating complexity and our ability to manage our environmental compliance or implement new initiatives.
Ryder Environmental Services supports our employees and businesses across the company by helping them implement initiatives and ensure we comply with relevant regulations. Our Environmental Team conducts regular facility compliance audits and assists our operations in conforming to the Ryder EMS. Energy use and utility data—including electricity, natural gas, water and solid waste—are continuously tracked through Ryder’s internal software. Each month, more than 4,500 utility bills are recorded within our environmental data tracking tool, and Environmental Services conducts regular and comprehensive audits of utility bills to identify reduction opportunities including locations with high costs or usage. Management processes are in place to ensure proper follow-up to reduce usage and costs through repairs and/or behavioral changes. In addition to auditing facilities, the Environmental Team continuously reviews environmental risks, aggregates data for annual sustainability reports, conducts trainings, and reviews environmental controls.
Energy & Emissions
The majority of Ryder’s energy and emissions footprint is generated in our downstream value chain, most notably from the fuel combustion and lifecycle GHG emissions associated with Ryder-leased vehicles operated by our customers. Ryder pursues energy savings through efficient, sustainable transportation solutions resulting in emission reductions, such as improved fuel economy, energy tracking with internal software, employee engagement campaigns through regular communication with the field, and implementation and improvement of internal equipment standards.
We follow and make available to our customers fuel saving recommendations provided by the U.S. EPA SmartWay program, and offer our customers industry-leading vehicle performance, optimized fuel efficiency and the ability to reduce carbon emissions. By utilizing our Dedicated Transportation Solutions and Supply Chain Solutions services, our customers benefit from maximizing freight tonnage delivered per shipment and per mile, putting fewer vehicles on the road and minimizing fleet emissions and related fuel costs. Additionally, our Fleet Management Solutions customers typically upgrade and replace equipment at the end of the lease term to ensure they are always equipped with the latest, most fuel efficient and environmentally friendly vehicles. To learn more about how we help our customers reduce the carbon footprint of their fleets, see Fleet Energy & Emissions.
Highlight Story: U.S. EPA Smartway® Partnership
In addition to managing the environmental footprint of our internal operations, Ryder Environmental Services measures fuel and energy efficiency metrics associated with fleet operations on behalf of our customers. Through our partnership with the U.S. Environmental Protection Agency’s (EPA) SmartWay® program, we measure, benchmark, and continuously improve our performance on environmental metrics associated with supply chain logistics and freight transportation. The SmartWay program enables us to promote energy efficiency and reduce GHG emissions for our customers by providing annual updates and implementing SmartWay Verified Technologies. In 2013, 2014, and 2017, Ryder was recognized by the U.S. Environmental Protection Agency with a SmartWay Excellence Award, for demonstrating top environmental performance in reducing transportation-related GHG emissions.
Energy Consumption
As an industry leader, we have a unique opportunity and ability to continually reduce the environmental impacts of our operations and those of the tens of thousands of customers we serve. Whether it’s deploying alternative fuel vehicles, optimizing distribution networks, or operating energy-efficient warehouses, Ryder helps customers reduce emissions and drive long-term value for their businesses. In particular, Ryder is focused on environmental issues related to fuel consumption, vehicle emissions, facility energy use, and automotive waste management.
The following table summarizes our historical energy consumption throughout our operations. Figures for the 2018 fiscal year have not yet been finalized as of publication of the report. We will supplement the table with 2018 information as soon as data are finalized.
|
Source
|
Units
|
2014
|
2015
|
2016
|
2017
|
|---|---|---|---|---|---|
Diesel consumption |
GJ |
9,635,066 |
9,640,398 |
10,500,586 |
10,097,272 |
Electricity consumption |
GJ |
1,040,129 |
989,545 |
886,588 |
844,285 |
Heating fuel consumption |
GJ |
695,193 |
630,062 |
592,925 |
607,252 |
Energy consumption |
GJ |
11,370,388 |
11,260,005 |
11,980,100 |
11,548,809 |
Energy consumption |
GJ |
not reported |
not reported |
not reported |
493,403 |
Total energy consumption |
GJ |
11,370,388 |
11,260,005 |
11,980,100 |
12,042,212 |
While stationary emissions are a much smaller part of our overall carbon footprint, we strive to minimize the energy use and GHG emissions associated with our shops, warehouses, and administrative buildings. Ryder has already achieved or exceeded its absolute target to reduce stationary emissions (Scope 1 and 2) at FMS shops by 20 percent by 2020 (against our 2009 baseline). Ryder’s Environmental and Real Estate Services Team conducts periodic site reviews and encourages shop managers to adopt routine building and equipment maintenance programs to save on energy demands. One of our major improvements over the last several years was switching to LED lights at many of our locations. LED lights last five times longer than fluorescent lights and use at least 75 percent less energy than incandescent lighting. To date, we have completed over 340 lighting upgrades to improve facility energy efficiency. Additionally, we encourage employees to identify, implement, and take ownership of initiatives that further reduce facility energy use through lighting management and improved equipment maintenance procedures. Business Unit Directors are incentivized to measure, track, and attain targets for energy use reductions and associated GHG emissions reductions from conservation programs, awareness campaigns, and other activities.
Field employees have access to the energy tracking and reporting tool that provides visibility into daily operations. Scope 1 and 2 stationary greenhouse gases are also tracked through this tool, which provides transparency to local operations. GHG trends are reported internally to Ryder Management. Through these and other initiatives, Ryder’s customers, shareholders and employees all benefit from GHG emissions reduction associated with decreased energy use.
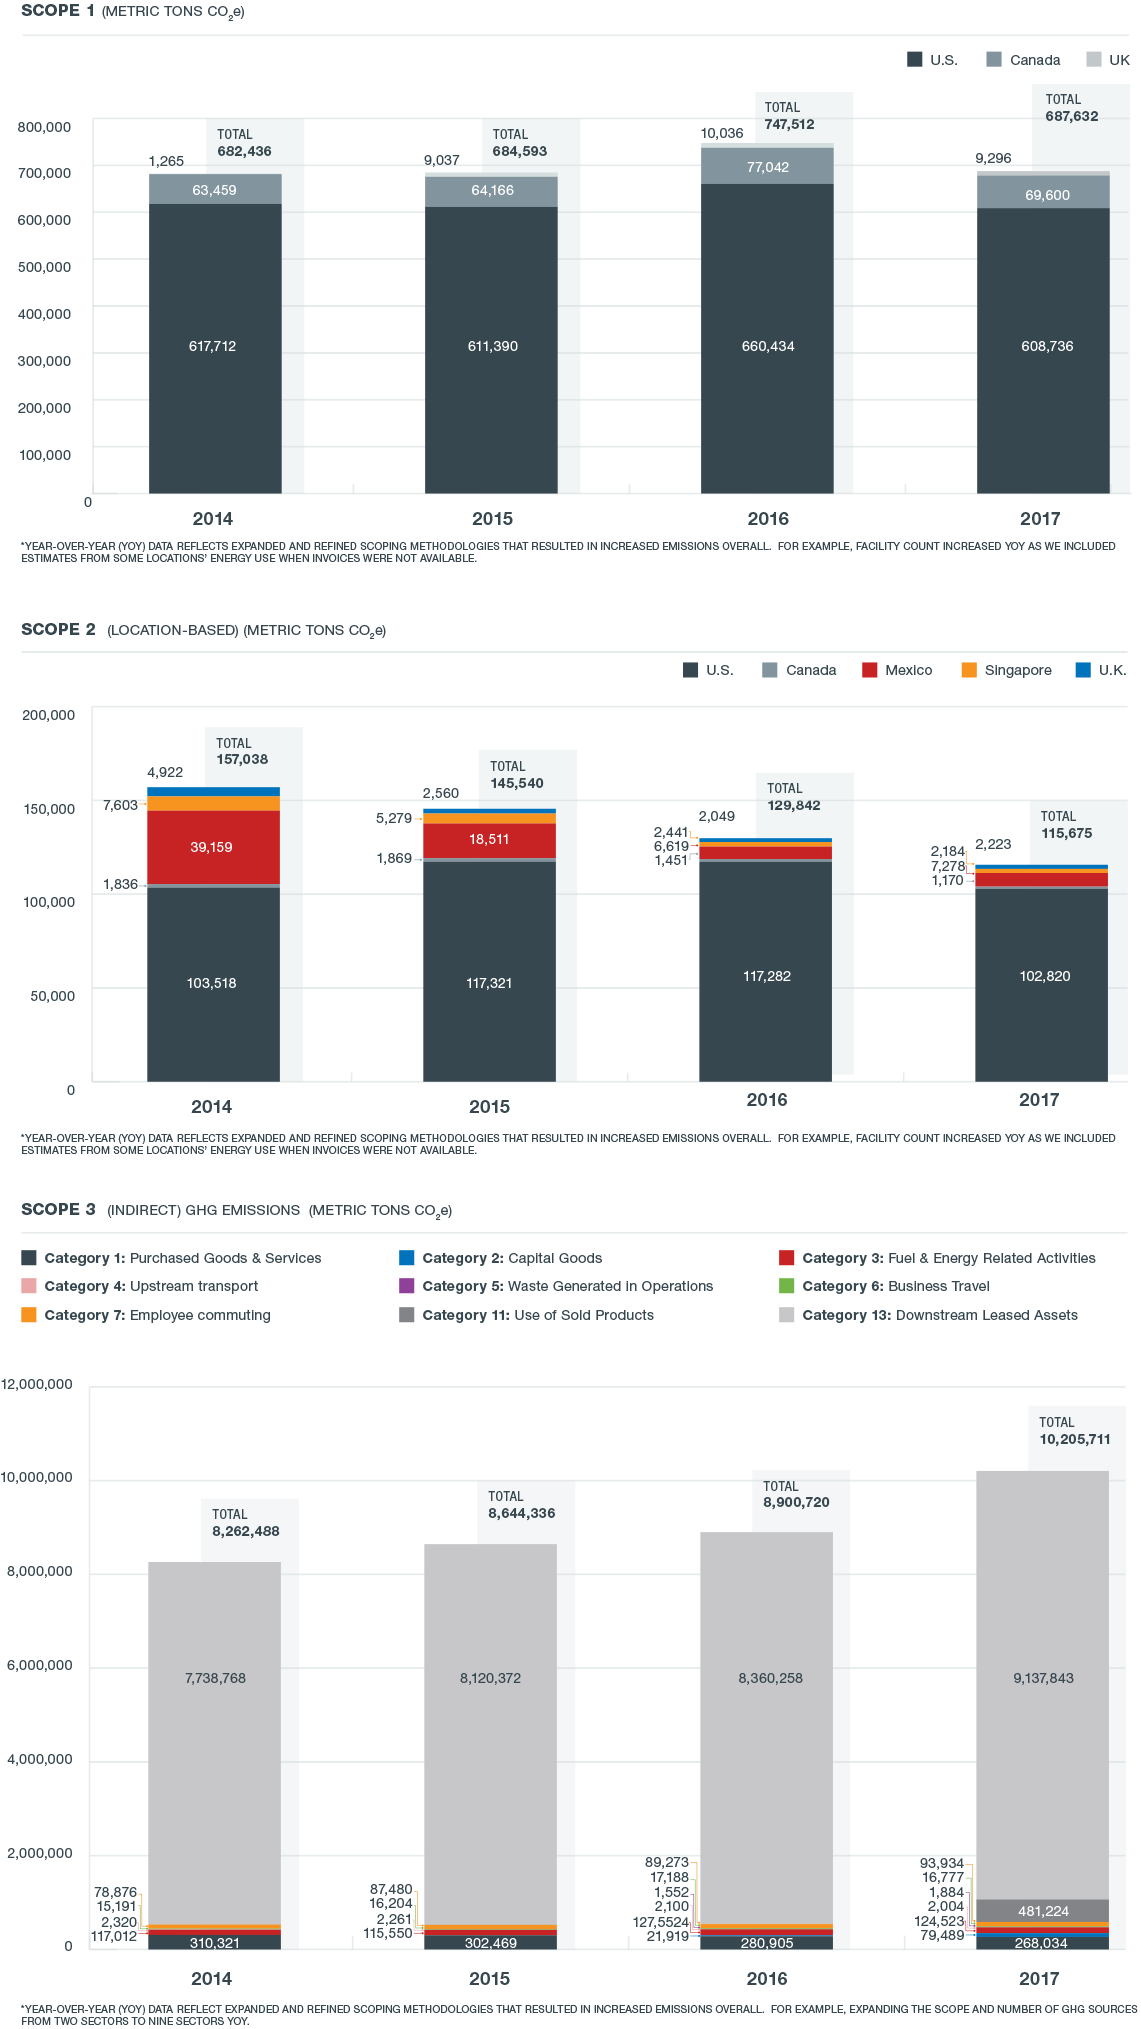
Ryder has been tracking Scope 3 emissions since 2008, but due to the lack of a comprehensive guideline, we did not publish Scope 3 emissions data in previous reports. In 2011, following publication of the first comprehensive Scope 3 GHG standard for identifying, computing, and reporting enterprise-wide value chain standards, Ryder began modeling and reporting Scope 3 emissions. The protocol identifies fourteen Scope 3 GHG sources, and in 2011, Ryder reported on two sources (business travel and employee commuting). Each year, Ryder has expanded the scope and number of sources. In 2012, Ryder expanded Scope 3 emissions reporting to include fuel emissions from customer leased vehicles. A total of six of the fourteen sources were reported, including two new downstream sources (use of sold products and downstream-leased assets), and two new upstream sources (fuel and energy-related activities, and upstream transportation and distribution). As of 2017, Ryder reports a total of nine of the fourteen sources, including purchased goods and services, capital goods, and waste generated in operations. This is in addition to expanding sources of our Scope 1 and 2 emissions. We also perform limited third-party annual verification of our emissions reporting process. To learn more about our emissions tracking and reporting, see our 2018 CDP Climate Change response.
We are continually evaluating and adjusting our internal management processes to improve emission reduction strategies on a larger strategic scale. For example, we recently incorporated new “energy saving” review criteria for new construction projects or major upgrades at owned sites. Our primary focus is to identify best practices for electricity and natural gas reductions.
We will continue to perform third-party verifications of our emissions accounting standards annually and integrate findings into new management standards.
The following charts outline our year-over-year GHG emissions performance, excluding figures for the 2018 fiscal year, which were not finalized as of the date of this report. We will supplement the charts below once such figures are available.
Emissions
Water Sustainability
Ryder recognizes the importance of water sustainability to ensure that high quality water remains available for future generations; however, water use is not material to our operations. Operations use water primarily for vehicle washing, restrooms, and employee wash areas. We measure, track, and report water use internally in order to identify conservation opportunities and to repair leaks as quickly as possible.
|
|
2009 (Baseline)
|
2015
|
2016
|
2017
|
|---|---|---|---|---|
Water Use (mgal) |
290,570 |
199,291 |
200,085 |
196,631 |
* Approximately 1% of water use is irrigation/landscaping, while the remainder is discharged to publicly owned treatment works (POTW) sewage facilities
Wastewater recovered from Ryder’s vehicle washing activities is either collected from wash bays and then discharged to municipal sewer or captured by mobile vacuum systems and carried offsite for pre-treatment through a multi-stage processing system. Once heavy solids are removed, treated water is discharged to publicly owned treatment works systems.
Vehicle Wash Water
|
Year
|
Wash water Collected (gal)
|
Treatment Methods
|
Disposal Destination
|
|---|---|---|---|
2018 |
4,000,000 |
Filtration, Pretreatment, Discharge to Permitted POTW |
POTW |
2017 |
3,600,000 |
Filtration, Pretreatment, Discharge to Permitted POTW |
POTW |
Waste & Recycling
Ryder has a long-standing commitment to waste reduction, both internally and for our customers. We work with Ryder-preferred and qualified vendors that prioritize diverting as much waste as possible away from landfills; who focus on waste recycling, reuse, and disposal; and who have significant experience with waste management, especially automotive waste. This allows us to maximize energy and cost efficiencies both internally and for our customers, collectively having a positive impact on the environment.
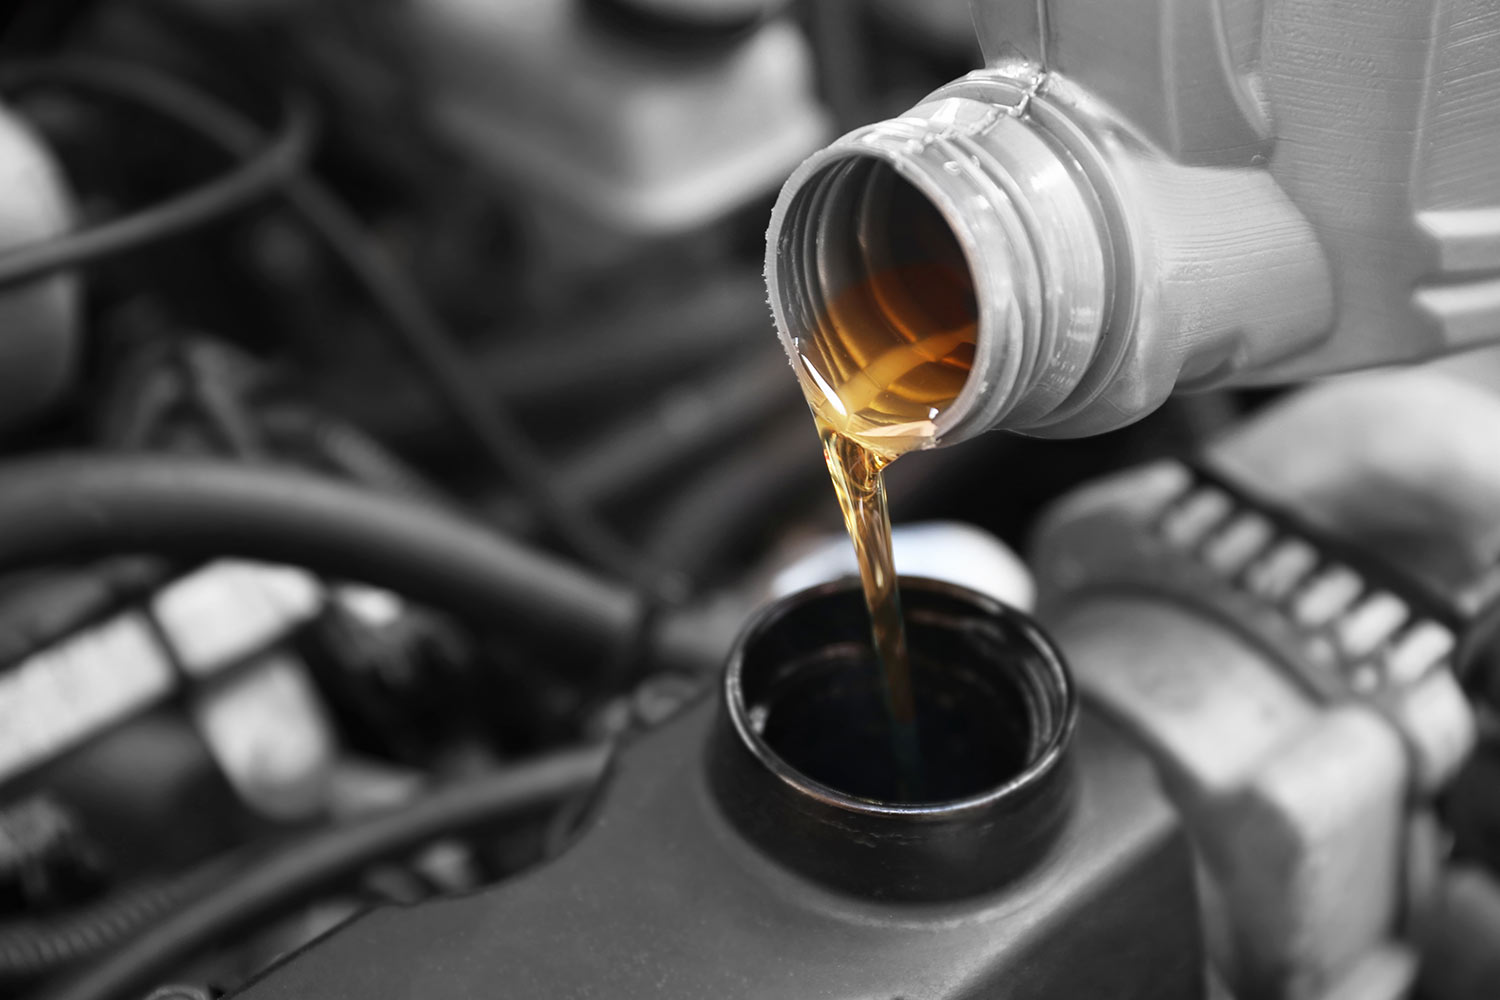
Automotive waste generated from our fueling and maintenance locations is our most significant waste stream, as our core business involves operating and maintaining a large vehicle fleet. In 1998, Ryder implemented a comprehensive automotive waste recycling program, which includes lubricants, used oil, solvents, used oil filters, tires, batteries, and oily water. Today, 98% of these waste products are either recycled, or refined and reused. We work closely with our primary waste disposal vendors to continually minimize waste while increasing recycling efforts company-wide.
- Example – Used oil recycling: Ryder’s vast network of fleet maintenance shops generate quality used oil, which is reused and/or recycled by our vendors. The refined oil yields finished base oils and light distillates.
- Example – Oil filter recycling: We routinely replace automotive oil filters during our preventive maintenance processes. Used oil filters are collected by Ryder’s preferred recycling vendors and are sent to recycling facilities that divert the material through a two-stage separation and shredding process, yielding shredded steel that can be reused, pulverized filter media that is recycled, and used oil that will be re-refined. The result is that virtually all material is either refined or used as an alternative energy source (e.g., as industrial fuel at cement kilns or energy plants that generate electricity).
Ryder Recycles
* Ryder crushes oil filters prior to recycling. Assumes 175 crushed used oil filters per 55 gal drum; 16.5 lbs per 55 gal; and 7.4 lbs/gal of used oil per drum.
Virtually all of Ryder’s automotive waste (hazardous and non-hazardous) is recovered and managed using preferred approved vendors who utilize re-use and/or recycle technologies versus landfill disposal. (ALL WASTES).
AUTOMOTIVE WASTE
|
Type of Waste
|
Unit
|
2016
|
2017
|
2018
|
|---|---|---|---|---|
Hazardous Waste* |
gallons |
48,332 |
42,069 |
47,516 |
Non-hazardous Liquid Waste |
gallons |
3,667,584 |
3,679,861 |
3,701,892 |
Scrap Batteries |
number |
115,204 |
128,912 |
127,591 |
Scrap Tires |
number |
77,469 |
83,092 |
87,536 |
* Parts washing solvents only. Volumes not reported are contaminated fuel, anti-freeze and automotive liquids.
Ryder Mixed Solid Waste and Recycling process
Ryder works closely with our primary solid waste disposal suppliers to increase waste minimization, waste diversion, and recycling efforts company-wide. Through a company mandate, we require all Ryder locations to implement recycling services, divert waste from landfills, and explore waste-to-energy technologies. Our Supply Chain Solutions business creates significant amounts of cardboard, and we continuously analyze cardboard recycling processes to identify improvement opportunities. Ryder operates compactors and augers to increase recycling efficiencies, and our teams work closely with our customers to implement best management practices.
NON-AUTOMOTIVE WASTE
|
Type of Waste
|
Unit
|
2016
|
2017
|
2018
|
|---|---|---|---|---|
Solid Waste* |
tons |
20,069 |
23,504 |
25,409 |
Recycled Waste** |
tons |
5,203 |
6,625 |
25,409 |
Electronic Waste total/recycled |
tons |
29 |
22 |
22 |
Universal Waste total/recycled*** |
lbs |
1,315 |
2,027 |
3,279 |
* Estimated based on 80% of locations only.
** Cardboard, paper, plastics, cans.
*** Light bulbs, small batteries (non-hazmat).
Additional Resources:
- CDP reports (on the Sustainability Page)